Teaching
Courses I design and teach, with the slides and class notes open to everyone.
Stat.BD · 1:1 course · 5 of 30 sessions released
Applied Biostatistics & Research Methodology for Clinical Research
A 1:1 course I designed for a practising clinician with ten years of clinical experience who is moving into research. I teach it through Stat.BD, which I founded. The plan is 30 sessions over 15 weeks, with 14 SPSS labs, and sessions are published here as they are taught.
Handed a medical paper you have never seen, in a field that is not yours, you can say out loud and in front of people what its question was, whether its design could answer it, what its numbers mean, where it is vulnerable, and whether you believe it.
How I teach it
-
No derivations
Every idea arrives through a paper or a patient.
-
Real papers from day one
Two published South Asian studies run through the whole course, read in full rather than as simplified extracts.
-
Build every number yourself
Each summary a paper prints is rebuilt by hand in Excel before any software is used. The SPSS lab always follows the concept and never leads it.
-
Start from what the learner knows
Clinical experience is treated as the one thing in the room that cannot be taught. Analogies come from the ward, not the textbook.
Syllabus
Four phases, each building the language the next one needs. Every released session has its projected slides and the student class notes; some add Excel practice workbooks.
Phase I · Statistical foundations
Sessions [object Object][object Object][object Object][object Object][object Object][object Object]
The language, summaries, distributions, sampling variability, confidence intervals, p values.
-
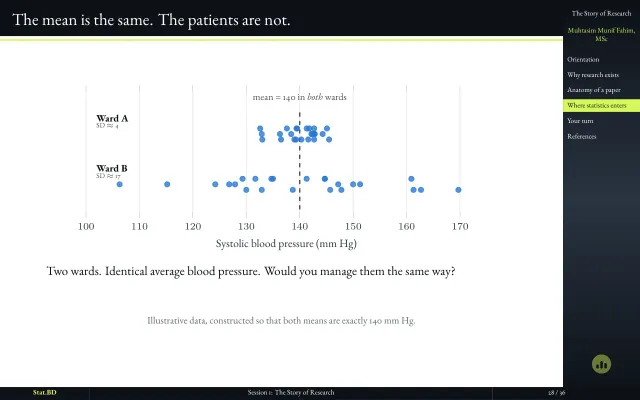
Session 1
The Story of Research
Where a research question comes from, and what statistics is actually for
-
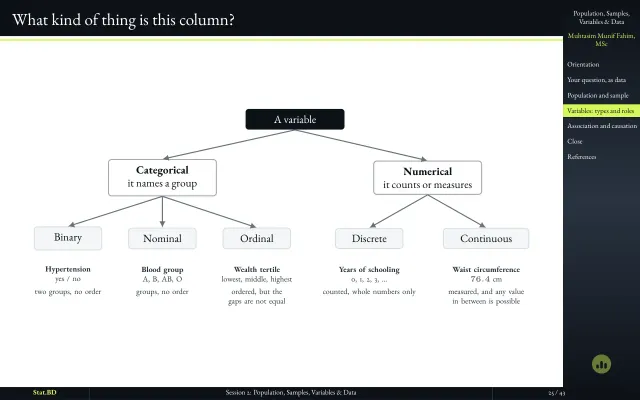
Session 2
Population, Samples, Variables & Data
What one row is, what one column is, and what job each column does
-
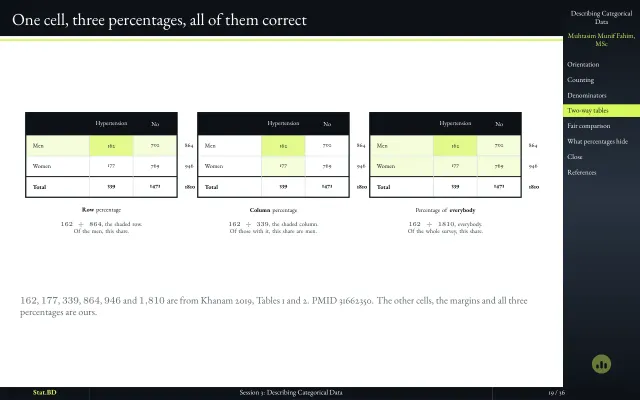
Session 3
Describing Categorical Data
Counts, and the four things people do to them
-
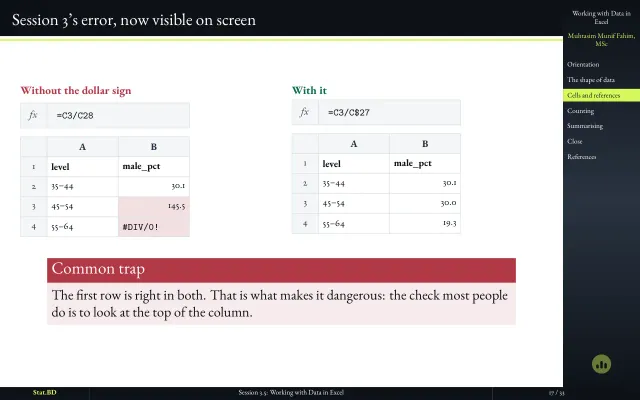
Session 3.5
Working with Data in Excel
Every number you have been shown, made by you instead
Excel workbooks: Practice register · Khanam tables · COBRA-BPS · Age bands · Worked solution
-
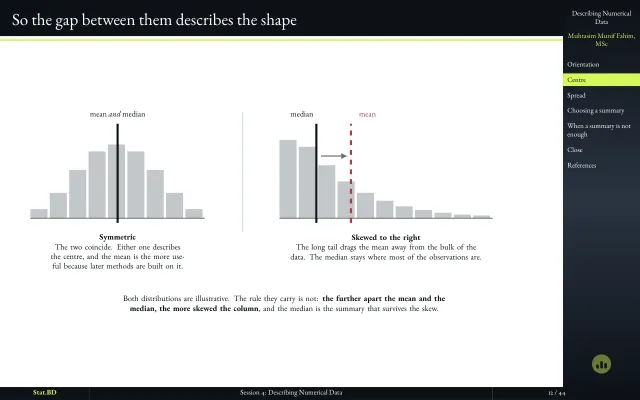
Session 4
Describing Numerical Data
Where the middle is, how spread out it is, and which pair of numbers to print
Excel workbooks: Practice data
-
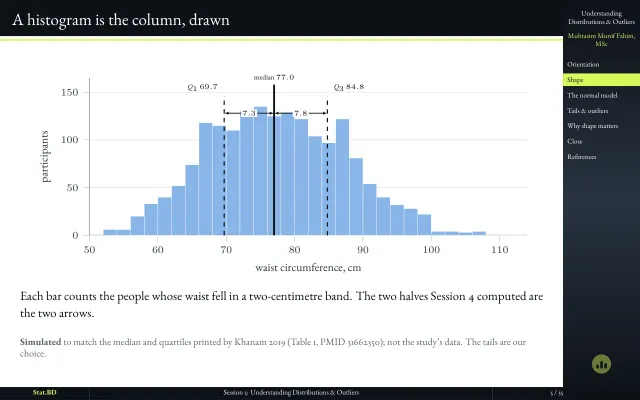
Session 5
Understanding Distributions & Outliers
What a column looks like, and the values out in its tails
- Sessions 6-8: released as they are taught.
Phase II · Research methodology
Sessions
Reading papers, questions, study designs, measurement, bias, sampling, sample size, protocol and ethics.
- Sessions 9-18: released as they are taught.
Phase III · Applied biostatistics
Sessions
Choosing a method, group comparisons, effect measures, regression, multivariable thinking.
- Sessions 19-26: released as they are taught.
Phase IV · Research literacy & communication
Sessions
Diagnostic and prediction studies, survival, systematic reviews, writing the manuscript.
- Sessions 27-30: released as they are taught.
Anchor papers, read in full on the publishers' sites: Jafar et al., NEJM 2020 (COBRA-BPS) · Khanam et al., BMJ Open 2019
Slides, class notes and workbooks © Muhtasim Munif Fahim / Stat.BD, shared under CC BY-NC 4.0. You are welcome to use them for non-commercial teaching with attribution.
Mentoring
Outside the course, I informally advise students on ML and statistics projects. I can help with:
- Reading guidance: what to read next (ML/NLP/NAS/causal inference) and how to take notes effectively.
- Project feedback: clarifying problem statements, evaluation plans, and research communication.
- Reproducibility: setting up experiments, baselines, and reporting results.
Email me with a short description of your background, what you're trying to do, and a concrete question. If you're asking for feedback on a project/paper, include a link and what kind of feedback you want.